


-
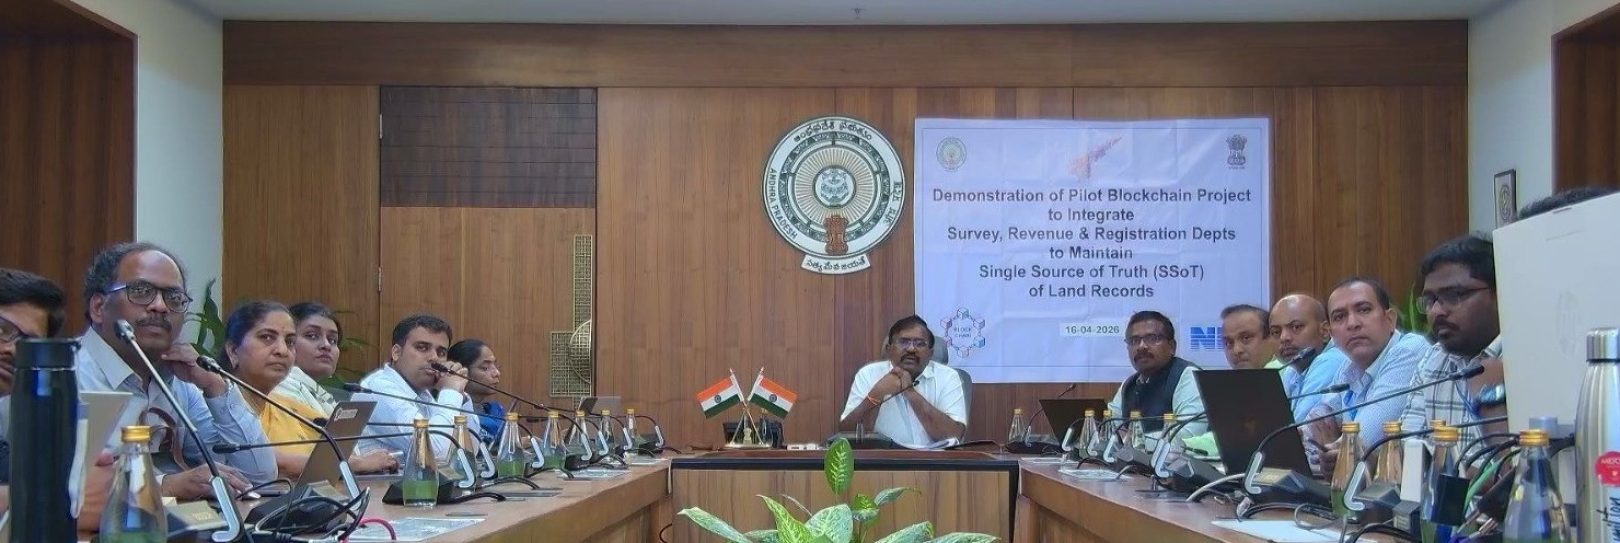
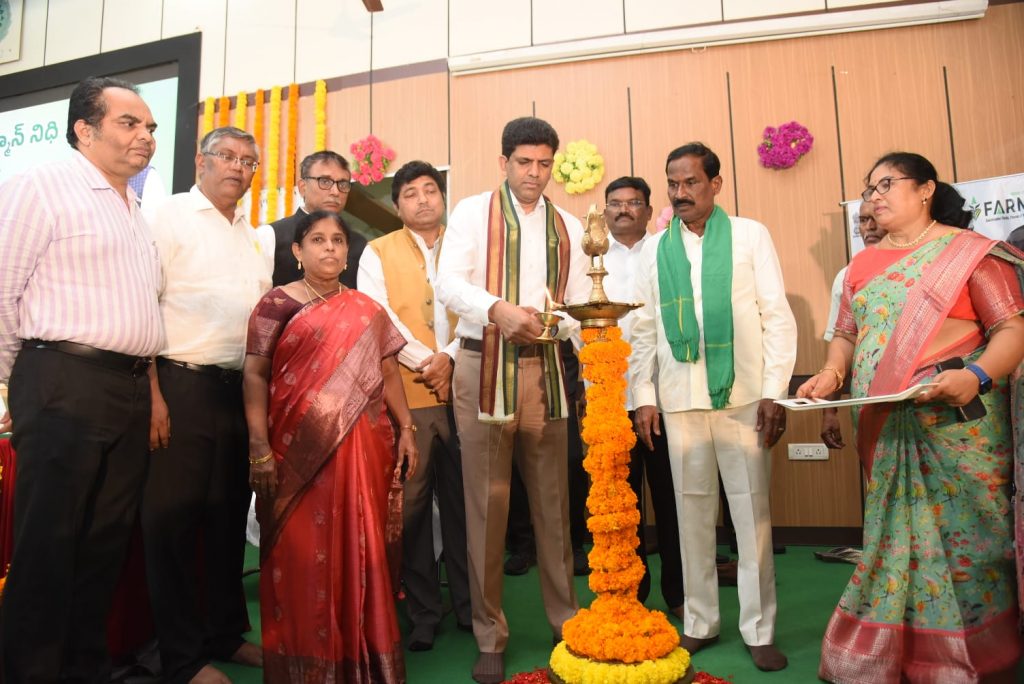
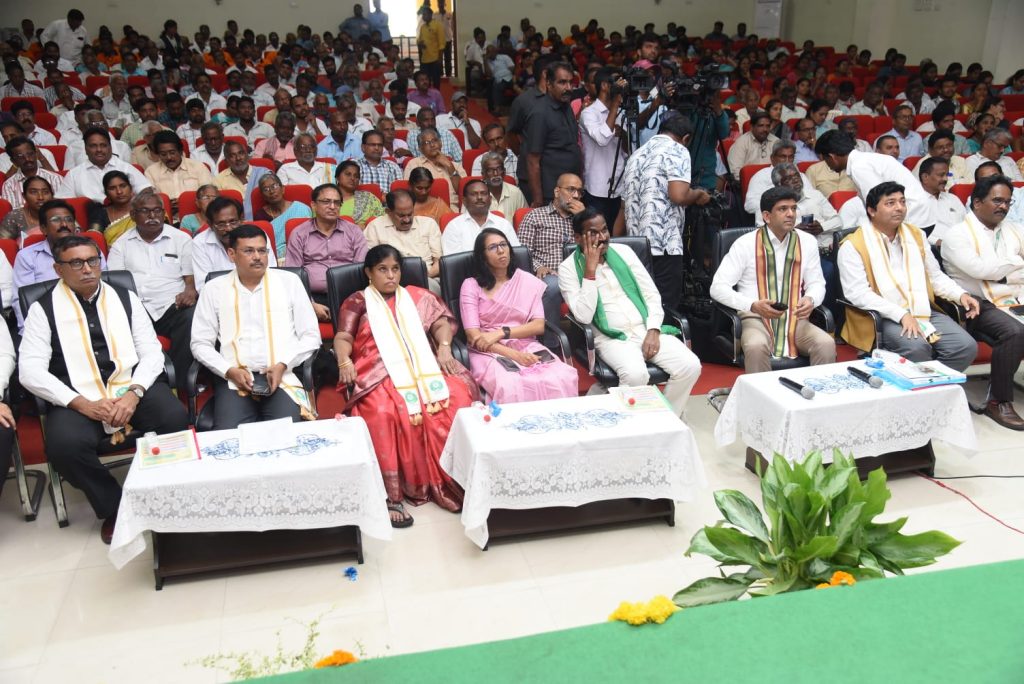
आंध्र प्रदेश सरकार के मुख्य सचिव कार्यालय में संपत्ति श्रृंखला प्रदर्शन
-
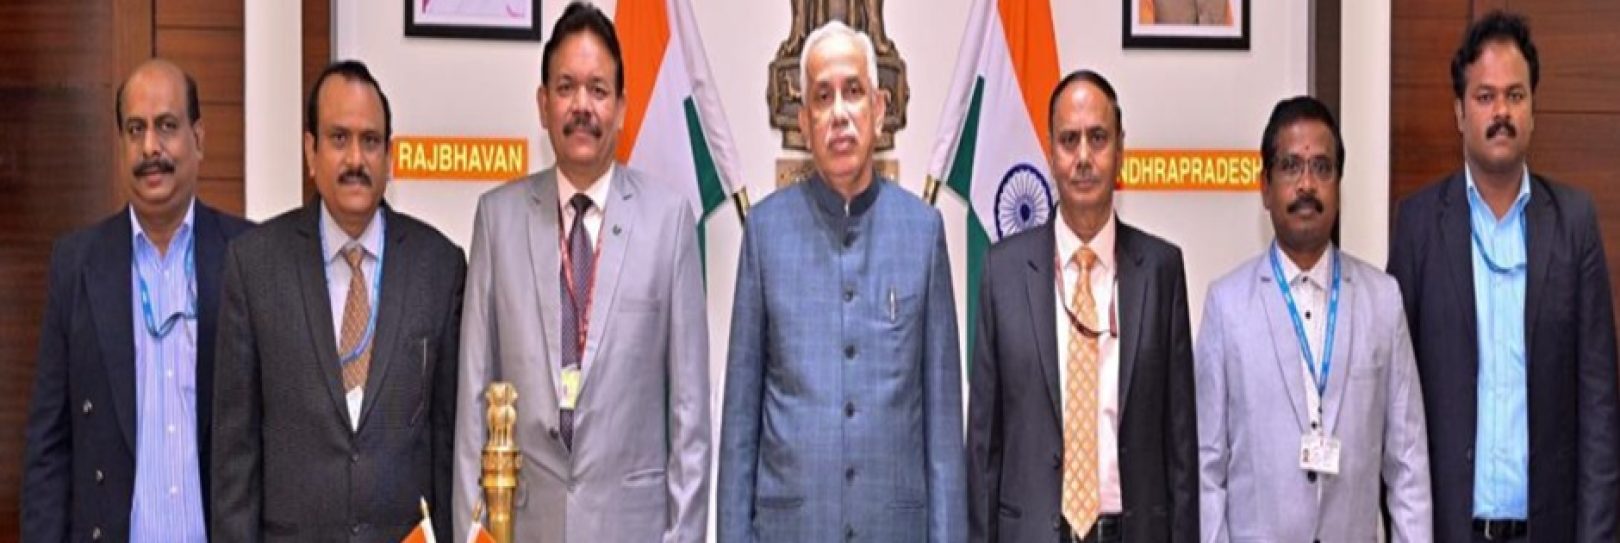
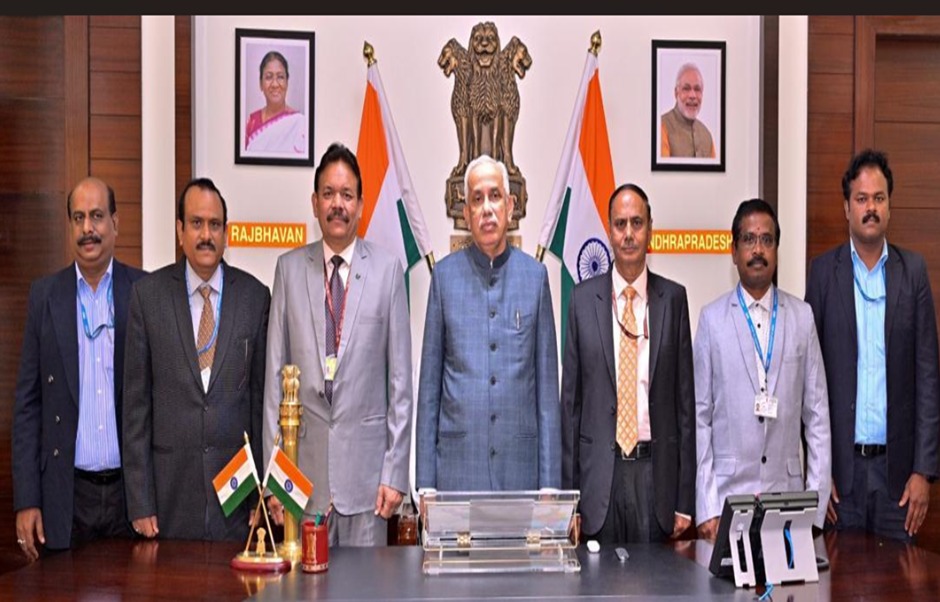
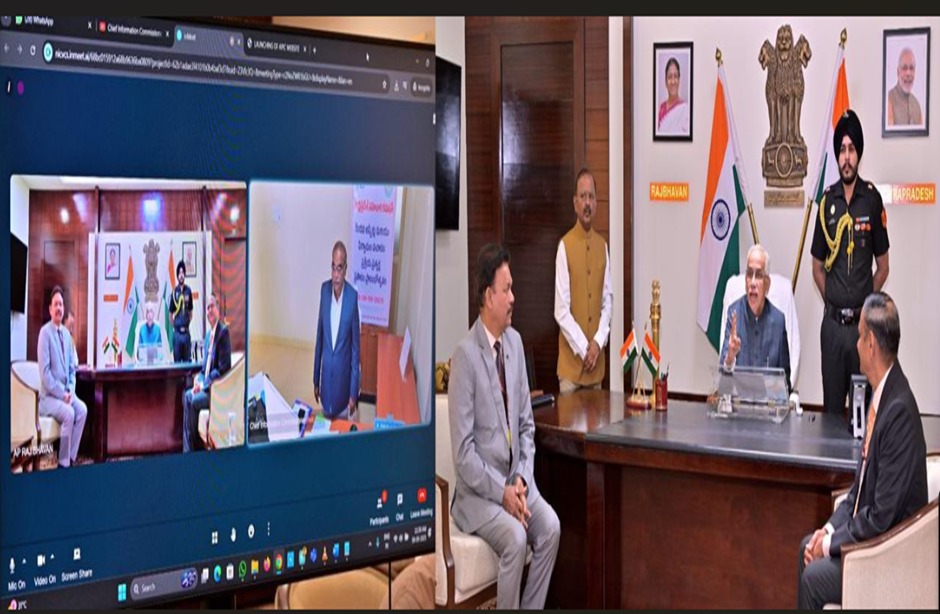
आंध्र प्रदेश के माननीय राज्यपाल ने सुनवाई की लाइव स्ट्रीमिंग का उद्घाटन किया और आंध्र प्रदेश सूचना आयोग की वेबसाइट का शुभारंभ किया।
-
भारत इनोवेट्स 2026
-
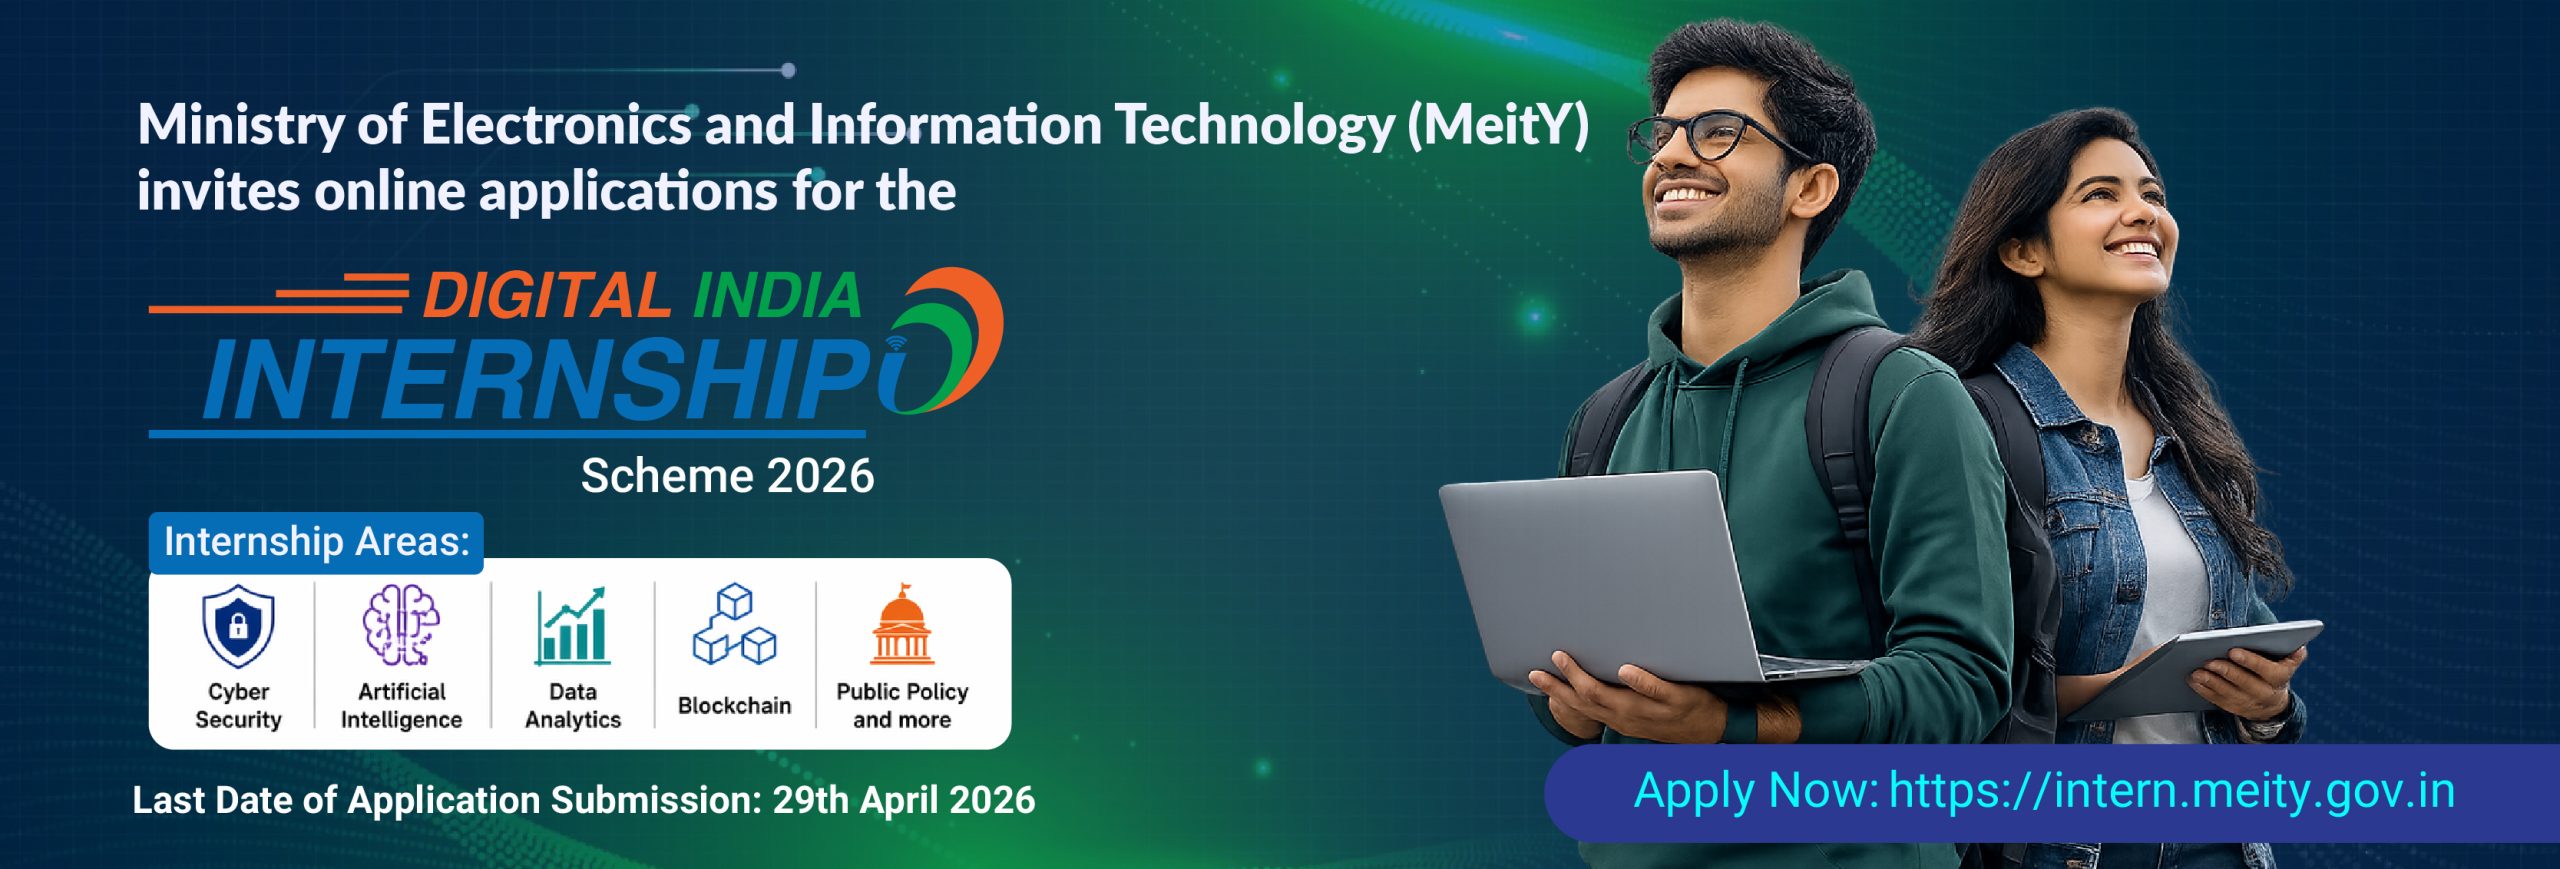
डिजिटल इंडिया इंटर्नशिप 2026
-
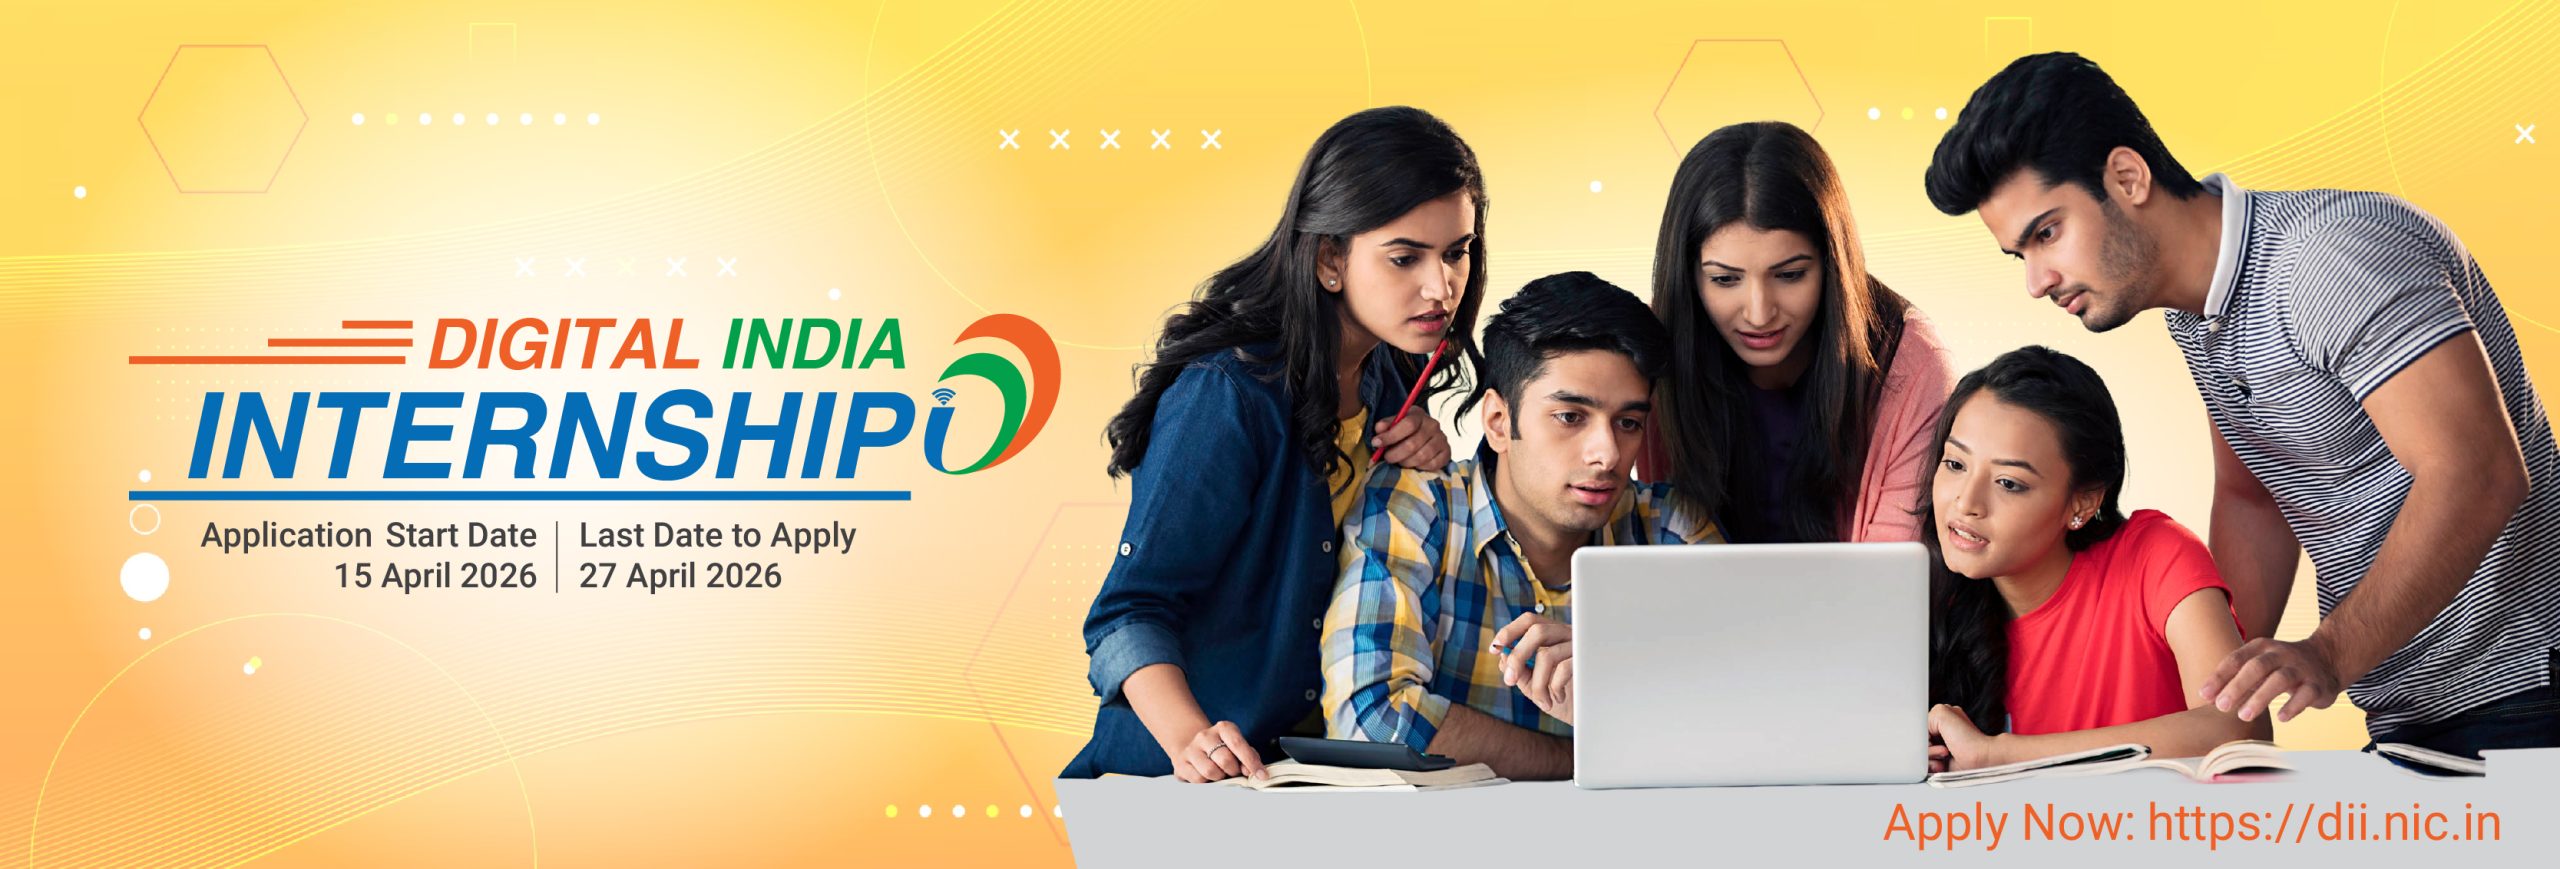
डिजिटल इंडिया इंटर्नशिप 2026
-
8वां केंद्रीय वेतन आयोग
-
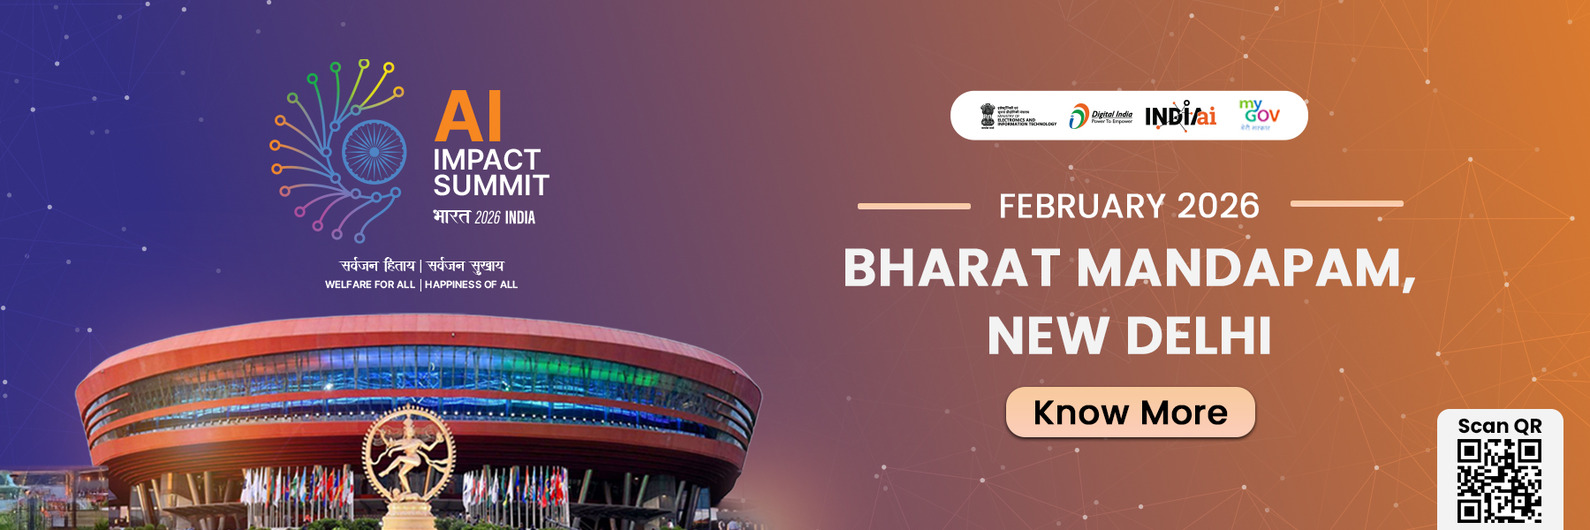
इंडिया एआई इम्पैक्ट समिट 2026
-

वंदे मातरम्
-
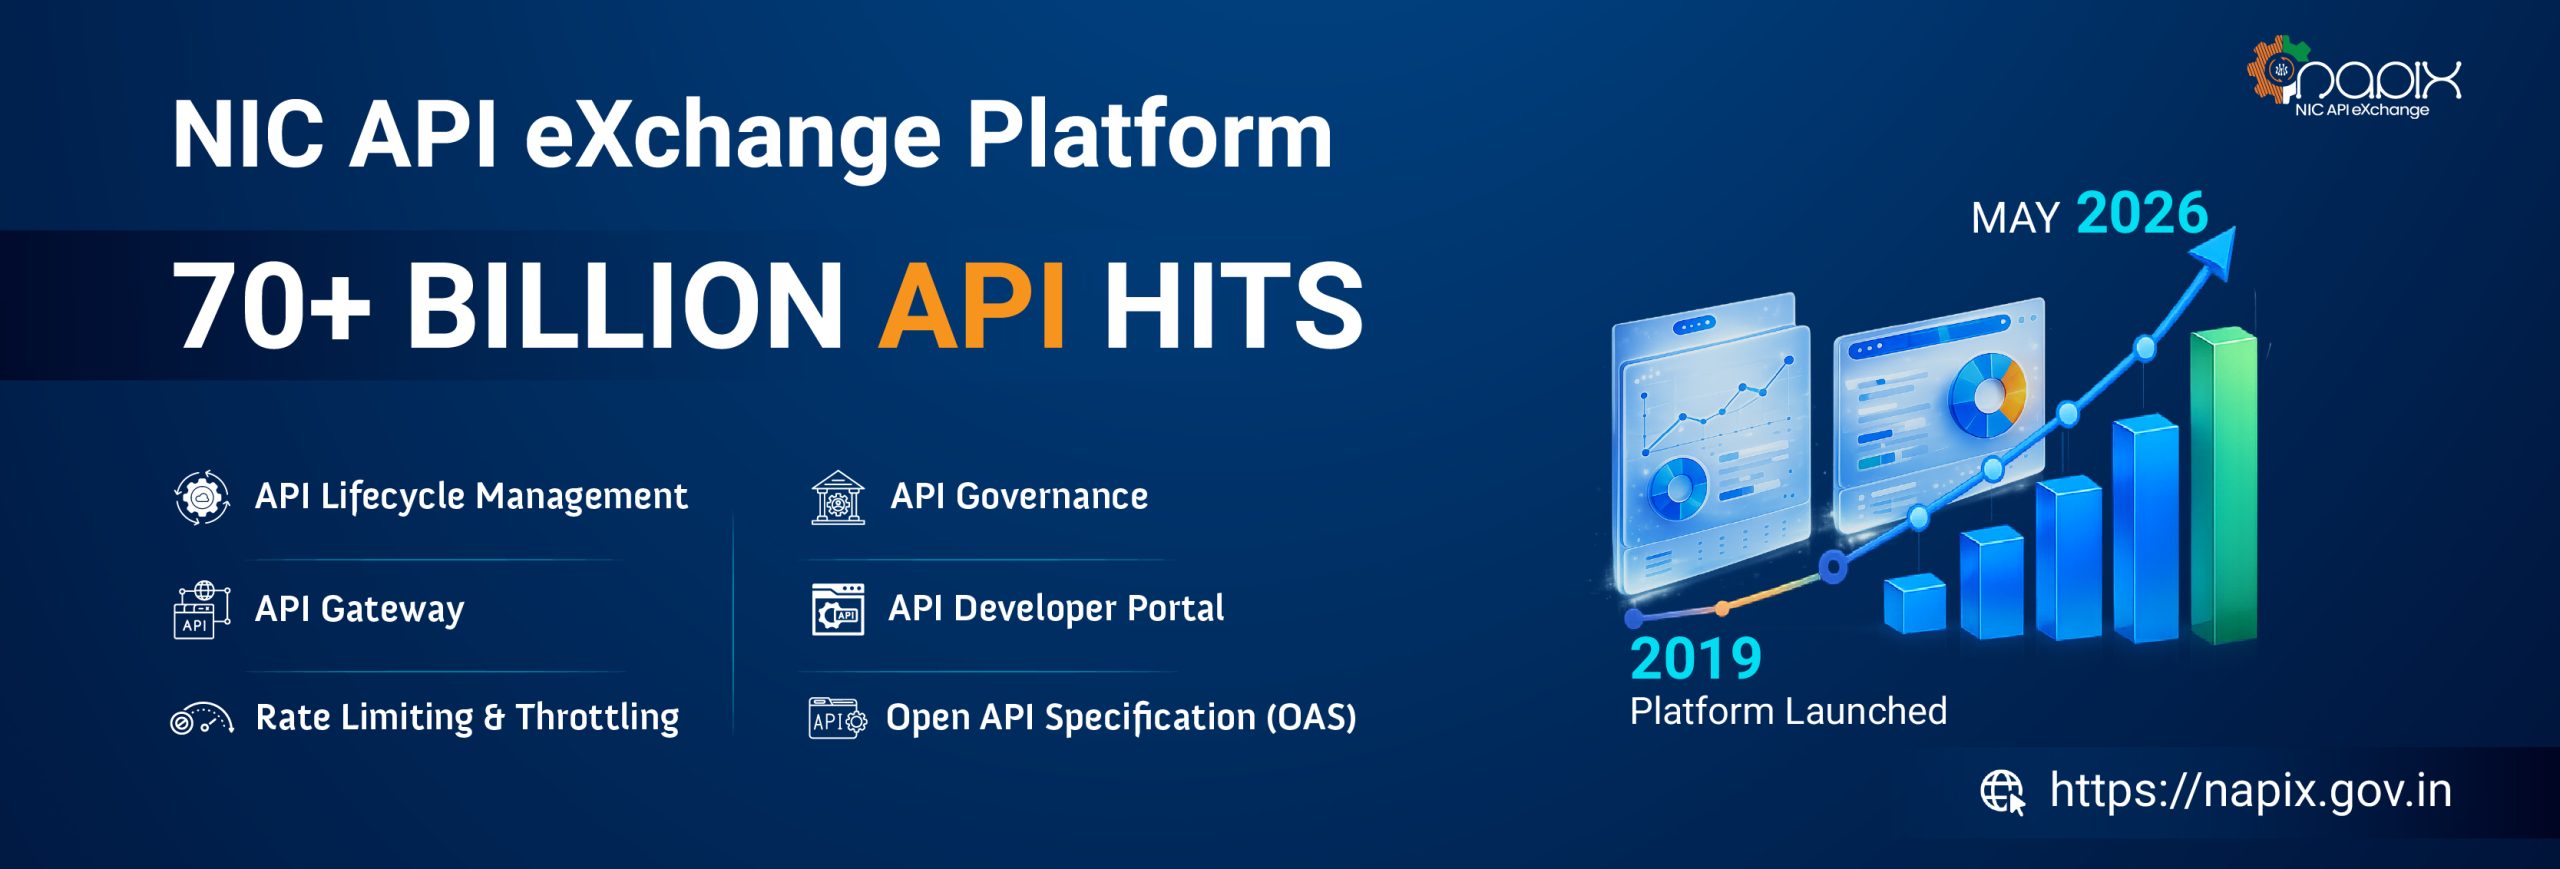
एनआईसी एपीआई एक्सचेंज प्लेटफॉर्म
-
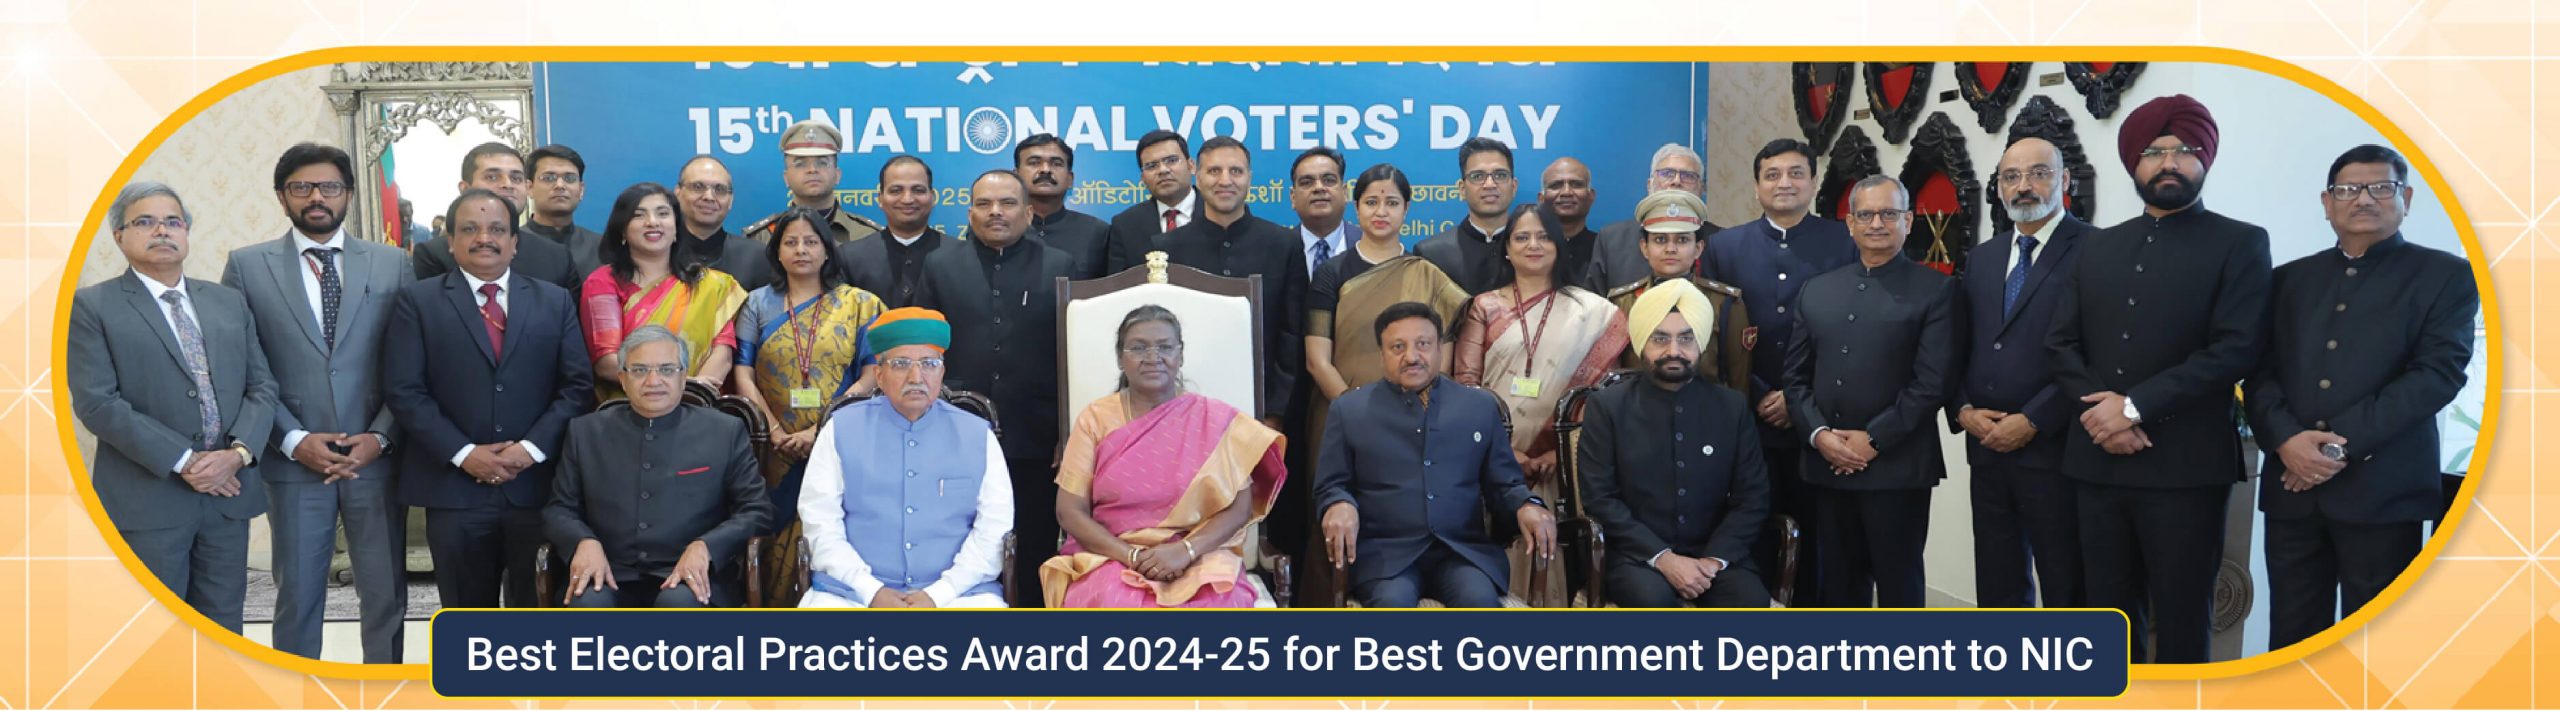
राष्ट्रीय मतदाता दिवस 2025
-
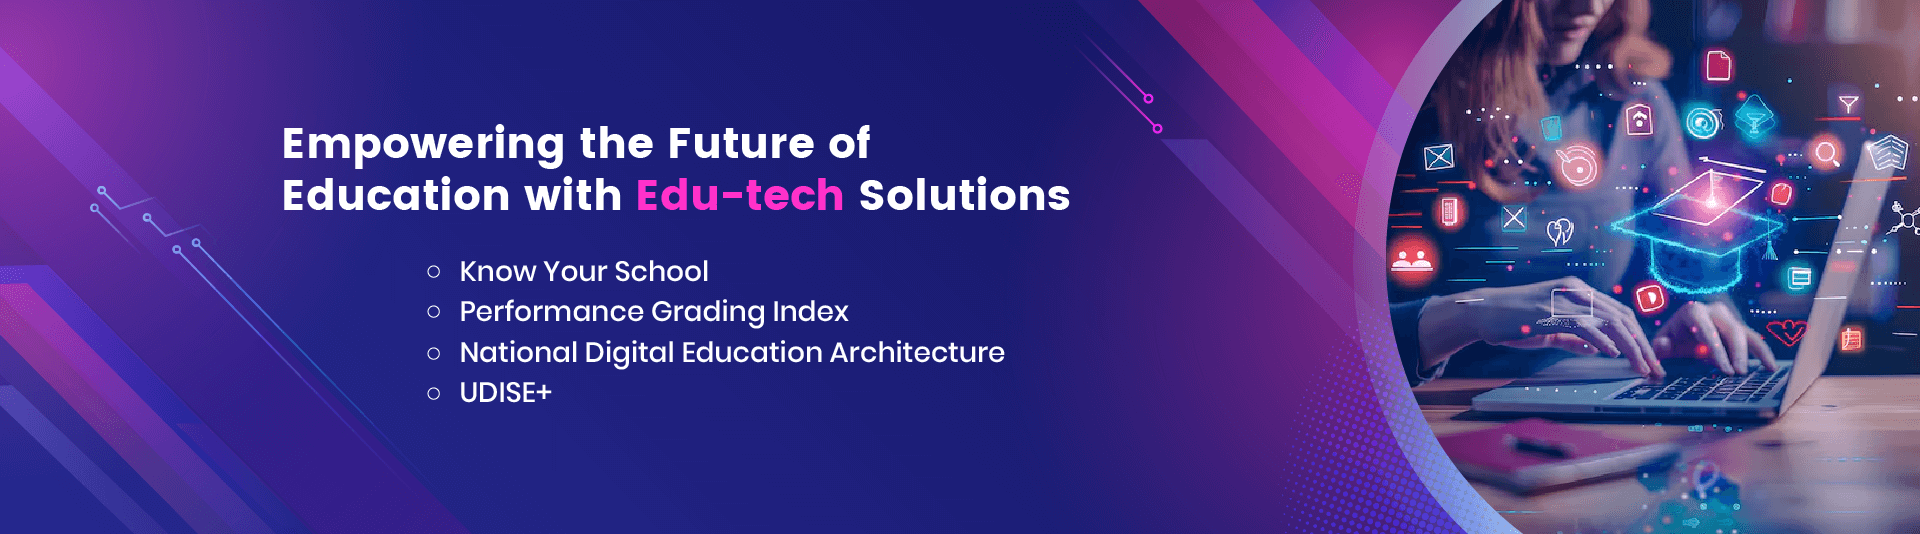
शिक्षा तकनीक समाधानों के साथ शिक्षा के भविष्य को सशक्त बनाना
-

वित्तीय प्रक्रियाओं को अधिक कुशल और पारदर्शी बनाने की दिशा में अगली पीढ़ी का फिन-टेक समाधान
-
डिजिटल कृषि प्लेटफार्म
हमारे बारे में
हमारे बारे में इलेक्ट्रॉनिक्स और सूचना प्रौद्योगिकी मंत्रालय (MeitY) के तहत राष्ट्रीय सूचना विज्ञान केंद्र (एनआईसी) 1976 में स्थापित किया गया था, और तब से यह जमीनी स्तर तक ई-गवर्नमेंट / ई-गवर्नेंस अनुप्रयोगों के “प्राइम बिल्डर” के रूप में उभरा है और साथ ही सतत विकास के लिए डिजिटल अवसरों के प्रमोटर के रूप में उभरा है। NIC, अपने ICT नेटवर्क, “NICNET” के माध्यम से, केंद्र सरकार के सभी मंत्रालयों / विभागों, 35 राज्य सरकारों / केंद्र शासित प्रदेशों और भारत के लगभाग 718 जिला प्रशासनों के साथ संस्थागत संबंध रखता है। एनआईसी केंद्र , राज्यों, जिलों और ब्लॉकों में सरकारी मंत्रालयों/विभागों मे ई-सरकार/ ई -गवर्नेंस अनुप्रयोगों को चलाने में सहायक रहा है, जिससे सरकारी सेवाओं में सुधार, व्यापक पारदर्शिता, विकेंद्रीकृत योजना और प्रबंधन को बढ़ावा देने में मदद मिली…
घटनाक्रम
नेक्स्टजेन ई-हॉस्पिटल पर दो दिवसीय कार्यशाला की रिपोर्ट 19 और...
नेक्स्टजेन ई-हॉस्पिटल पर दो दिवसीय कार्यशाला की रिपोर्ट 19 और 20 मई, 2026 को आयोजित
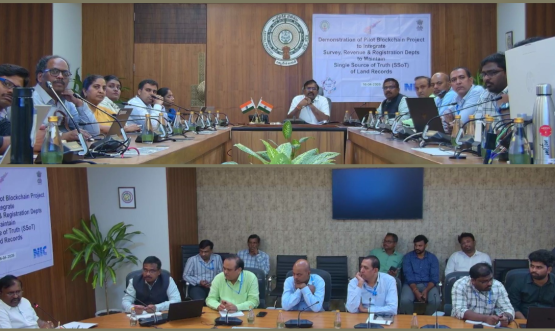
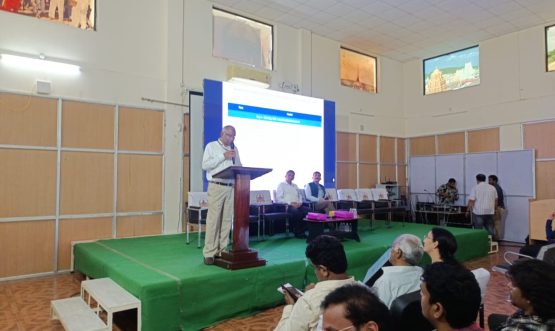
आंध्र प्रदेश सरकार के मुख्य सचिव कार्यालय में संपत्ति श्रृंखला...
आंध्र प्रदेश सरकार के मुख्य सचिव कार्यालय में संपत्ति श्रृंखला प्रदर्शन
पुरस्कार
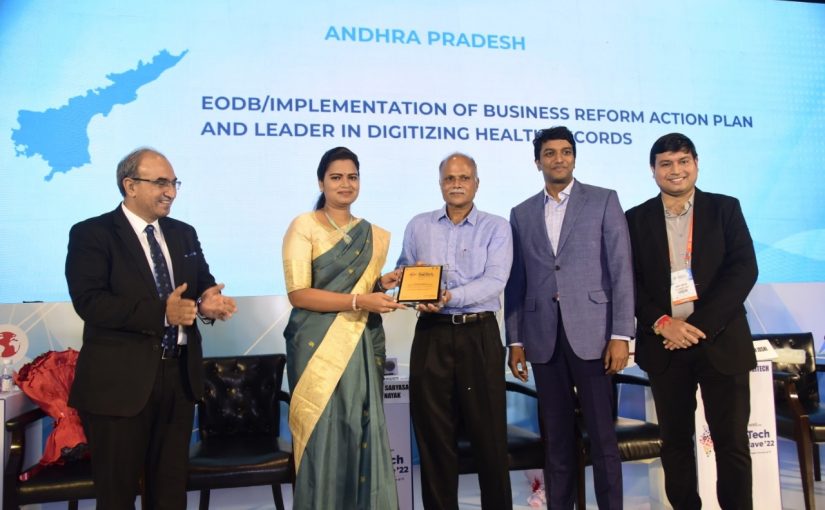
डिजिटल हेल्थ आंध्र प्रदेश ने एनआईसी...
डिजिटल हेल्थ एपी – इकोनॉमिक टाइम्स एंड डेलॉइट द्वारा आयोजित नेशनल डिजीटेक कॉन्क्लेव 2022 में डिजिटल हेल्थ में नेशनल लीडर…
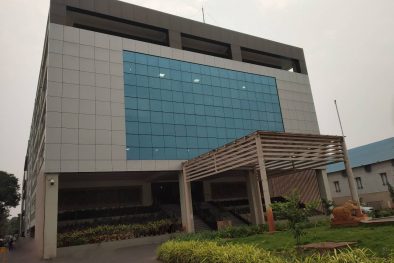
राष्ट्रीय सूचना विज्ञान केंद्र
Andhra Pradesh State Center
3rd floor, R and B building
MG Road
Vijayawada, AP 520010